
What Is a Stats Formula Sheet, and Which Statistics Formulas, Tables, and Examples Does It Include?
A stats formula sheet is a reference list of statistics formulas organized by topic. The official AP Statistics sheet comes from the College Board. Formulas fall into 8 groups: descriptive statistics, probability, random variables and distributions, sampling distributions, confidence intervals, hypothesis tests, chi-square tests, and regression. Calculators are permitted on the AP Statistics exam, and reference materials are available in print and in Bluebook. The College Board revised the course for the May 2027 exam.
For a reliable reference, consult College Board AP Statistics course information.
What Is a Stats Formula Sheet?
A stats formula sheet is a reference document that lists statistics formulas, symbols, and probability tables grouped by topic. Types include official exam sheets, textbook appendices, and course cheat sheets.
The AP Statistics formula sheet is the best-known official example. Formulas on a sheet give the calculation. Definitions, conditions, and interpretations come from course knowledge. The AP Statistics sheet omits definitions, rules, and interpretations of results.
What Is on the Official AP Statistics Formula Sheet?
The official AP Statistics sheet contains formulas for descriptive statistics, probability and distributions, and inference, followed by probability tables.
- Section I: descriptive statistics, including the mean, sample standard deviation, regression line, correlation, and slope formulas
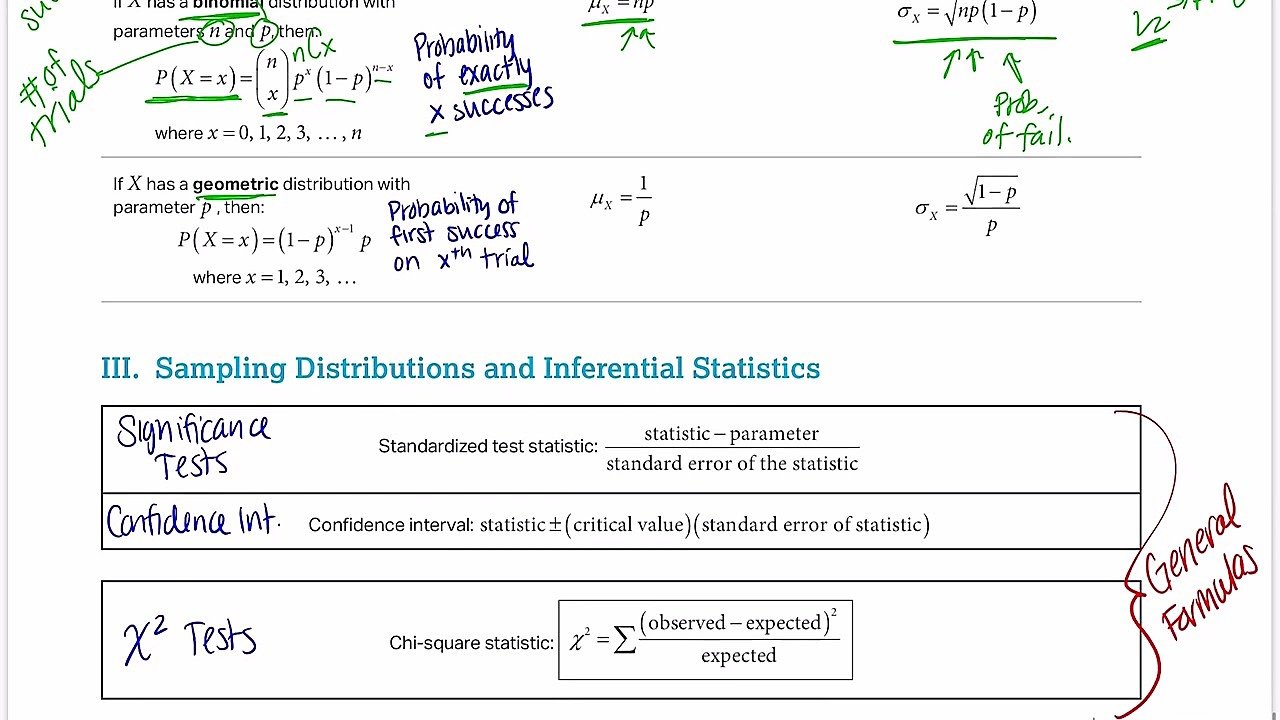
- Section II: probability and distributions, including the addition rule, conditional probability, the mean and standard deviation of a discrete random variable, and the binomial and geometric formulas
- Section III: inference formulas, including confidence intervals and test statistics
- Tables: 3 probability tables at the back of the sheet, which cover the standard normal distribution, the t distribution, and the chi-square distribution
Is the Stats Formula Sheet Provided on the Exam?
Yes, the College Board provides the AP Statistics reference sheet, and the sheet is printed for schools and available in Bluebook. Reference materials are printed and mailed to schools, and they are available in Bluebook in the test preview and on exam day.
Calculators are permitted. A student uses the College Board sheet and not a personal sheet.
Where Can Students Download the Official Stats Formula Sheet?
The official PDF is on AP Central under the AP Statistics exam page, titled Exam Reference Information. The 2026 version carries a College Board copyright mark for 2025 and instructs proctors to collect the sheet at the end of the exam.
The current Course and Exam Description appendix holds the latest version, since the course was revised for 2026-27.
What Changes in AP Statistics for the May 2027 Exam?
The revised AP Statistics course launches with the May 2027 exam, with 5 units and 4 free-response questions. The College Board consolidates the units into 5 and reduces the free-response questions from 6 to 4.
- May 2026 format: 40 multiple-choice questions in 90 minutes and 6 free-response questions in 90 minutes
- May 2027 delivery: fully digital testing through Bluebook
- May 2027 multiple choice: 42 questions with 4 answer choices each
- May 2027 free response: 4 questions in 90 minutes
- Calculators in 2027: a built-in Desmos graphing calculator in Bluebook, plus approved handheld graphing calculators
- Removed topics: reports on the revision list the geometric distribution and chi-square goodness of fit among the removed topics
The May 2027 reference sheet may differ from the 2026 sheet because of the removed topics.
What Are the Descriptive Statistics Formulas?
Descriptive statistics formulas measure center, spread, and position of a data set.
| Quantity | Formula | Variables and Conditions |
|---|---|---|
| Sample mean | x̄ = Σxᵢ/n | Observations xᵢ, sample size n |
| Population mean | μ = Σxᵢ/N | Population size N |
| Median | Middle value of ordered data | Mean of the 2 middle values when n is even |
| Range | Maximum − Minimum | Largest and smallest values |
| Sample variance | s² = Σ(xᵢ − x̄)²/(n − 1) | Divisor n − 1 for samples |
| Sample standard deviation | s = √[Σ(xᵢ − x̄)²/(n − 1)] | Square root of the sample variance |
| Population standard deviation | σ = √[Σ(xᵢ − μ)²/N] | Divisor N for populations |
| Interquartile range | IQR = Q₃ − Q₁ | Quartiles Q₁ and Q₃ |
| Outlier fences | Q₁ − 1.5(IQR) and Q₃ + 1.5(IQR) | Values beyond a fence are outliers |
| z-score | z = (x − μ)/σ | Value x, mean μ, standard deviation σ |
| Linear transformation | μ_new = a + bμ and σ_new = |b|σ | New values y = a + bx |
| Coefficient of variation | CV = (s/x̄) × 100% | Positive mean x̄ |
What Is the Empirical Rule?
The empirical rule states that about 68%, 95%, and 99.7% of values in a normal distribution lie within 1, 2, and 3 standard deviations of the mean.
| Interval | Share of Values |
|---|---|
| μ ± 1σ | 68% |
| μ ± 2σ | 95% |
| μ ± 3σ | 99.7% |
What Are the Probability Formulas?
Probability formulas combine the probabilities of events through complements, unions, intersections, and conditions.
| Rule | Formula | Variables and Conditions |
|---|---|---|
| Probability range | 0 ≤ P(A) ≤ 1 | Any event A |
| Complement | P(Aᶜ) = 1 − P(A) | Event A not occurring |
| Addition rule | P(A ∪ B) = P(A) + P(B) − P(A ∩ B) | Any events A and B |
| Mutually exclusive events | P(A ∪ B) = P(A) + P(B) | P(A ∩ B) = 0 |
| Conditional probability | P(A | B) = P(A ∩ B)/P(B) | P(B) > 0 |
| Multiplication rule | P(A ∩ B) = P(A)P(B | A) | Any events A and B |
| Independent events | P(A ∩ B) = P(A)P(B) | P(A | B) = P(A) |
| Bayes' theorem | P(A | B) = P(B | A)P(A)/P(B) | P(B) > 0 |
| Combinations | nCr = n!/[r!(n − r)!] | Choose r items from n, order ignored |
What Are the Random Variable and Distribution Formulas?
These formulas give the mean and standard deviation of random variables, with binomial, geometric, normal, and Poisson models.
| Quantity | Formula | Variables and Conditions |
|---|---|---|
| Mean of a discrete random variable | μ_X = E(X) = Σxᵢ·P(xᵢ) | Values xᵢ, probabilities P(xᵢ) |
| Standard deviation of a discrete random variable | σ_X = √[Σ(xᵢ − μ_X)²·P(xᵢ)] | Square root of the variance |
| Linear transformation | μ_(a+bX) = a + bμ_X and σ_(a+bX) = |b|σ_X | Constants a and b |
| Sum or difference | μ_(X±Y) = μ_X ± μ_Y and σ²_(X±Y) = σ²_X + σ²_Y | Independent X and Y |
| Binomial probability | P(X = x) = nCx · pˣ(1 − p)ⁿ⁻ˣ | n trials, success probability p, x = 0 to n |
| Binomial mean and standard deviation | μ = np and σ = √[np(1 − p)] | Independent trials, constant p |
| Geometric probability | P(X = x) = (1 − p)ˣ⁻¹p | First success on trial x, x = 1, 2, 3, … |
| Geometric mean and standard deviation | μ = 1/p and σ = √(1 − p)/p | Success probability p |
| Normal standardization | z = (x − μ)/σ | Table lookup for areas |
| Poisson probability | P(X = x) = e⁻ˡλˣ/x! | Rate λ, mean and variance both equal λ |
What Are the Sampling Distribution Formulas?
Sampling distribution formulas give the mean and standard deviation of a sample proportion or sample mean.
| Statistic | Mean | Standard Deviation | Conditions |
|---|---|---|---|
| Sample proportion p̂ | μ_p̂ = p | σ_p̂ = √[p(1 − p)/n] | np ≥ 10 and n(1 − p) ≥ 10 |
| Sample mean x̄ | μ_x̄ = μ | σ_x̄ = σ/√n | Normal population or n ≥ 30 |
| Difference of proportions p̂₁ − p̂₂ | p₁ − p₂ | √[p₁(1 − p₁)/n₁ + p₂(1 − p₂)/n₂] | Independent samples |
| Difference of means x̄₁ − x̄₂ | μ₁ − μ₂ | √(σ₁²/n₁ + σ₂²/n₂) | Independent samples |
The 10% condition requires n ≤ 0.10N when sampling without replacement from a population of size N.
What Are the Confidence Interval Formulas?
Every confidence interval has the form statistic ± (critical value)(standard error).
| Interval | Formula | Variables and Conditions |
|---|---|---|
| One proportion | p̂ ± z*√[p̂(1 − p̂)/n] | Critical value z* |
| One mean | x̄ ± t*(s/√n) | Critical value t*, df = n − 1 |
| Two proportions | (p̂₁ − p̂₂) ± z*√[p̂₁(1 − p̂₁)/n₁ + p̂₂(1 − p̂₂)/n₂] | Independent samples |
| Two means | (x̄₁ − x̄₂) ± t*√(s₁²/n₁ + s₂²/n₂) | Independent samples |
| Matched pairs | d̄ ± t*(s_d/√n) | Mean difference d̄, df = n − 1 |
| Slope | b ± t*(s_b) | df = n − 2 |
| Sample size, proportion | n = (z*/ME)² · p̂(1 − p̂) | Margin of error ME, p̂ = 0.5 when unknown |
| Sample size, mean | n = (z*σ/ME)² | Known σ |
The table lists critical values for 3 confidence levels.
| Confidence Level | z* | t* (df = 10) | t* (df = 24) | t* (df = 30) | t* (df = 100) |
|---|---|---|---|---|---|
| 90% | 1.645 | 1.812 | 1.711 | 1.697 | 1.660 |
| 95% | 1.960 | 2.228 | 2.064 | 2.042 | 1.984 |
| 99% | 2.576 | 3.169 | 2.797 | 2.750 | 2.626 |
What Are the Hypothesis Test Formulas?
Every test statistic has the form (statistic − parameter)/(standard error). The decision rule rejects the null hypothesis when the p-value is less than or equal to the significance level α.
| Test | Test Statistic | Variables and Conditions |
|---|---|---|
| One proportion z-test | z = (p̂ − p₀)/√[p₀(1 − p₀)/n] | Null proportion p₀ |
| One mean t-test | t = (x̄ − μ₀)/(s/√n) | df = n − 1 |
| Two proportion z-test | z = (p̂₁ − p̂₂)/√[p̂_c(1 − p̂_c)(1/n₁ + 1/n₂)] | Pooled p̂_c = (x₁ + x₂)/(n₁ + n₂) |
| Two mean t-test | t = (x̄₁ − x̄₂)/√(s₁²/n₁ + s₂²/n₂) | df from software or min(n₁, n₂) − 1 |
| Matched pairs t-test | t = d̄/(s_d/√n) | df = n − 1 |
| Slope t-test | t = b/s_b | df = n − 2 |
What Are the Chi-Square Formulas?
Chi-square tests compare observed counts with expected counts through χ² = Σ(O − E)²/E.
| Quantity | Formula | Variables and Conditions |
|---|---|---|
| Chi-square statistic | χ² = Σ(O − E)²/E | Observed count O, expected count E |
| Expected count, two-way table | E = (row total)(column total)/(table total) | Independence and homogeneity tests |
| Degrees of freedom, goodness of fit | df = categories − 1 | One categorical variable |
| Degrees of freedom, two-way table | df = (rows − 1)(columns − 1) | Independence and homogeneity tests |
| Condition | Every expected count is at least 5 | Large-count condition |
What Are the Regression and Correlation Formulas?
Regression formulas build the least-squares line ŷ = a + bx from the correlation r and the means and standard deviations of x and y.
| Quantity | Formula | Variables and Conditions |
|---|---|---|
| Least-squares line | ŷ = a + bx | Predicted value ŷ |
| Slope | b = r(s_y/s_x) | Correlation r, standard deviations s_x and s_y |
| Intercept | a = ȳ − bx̄ | Means x̄ and ȳ |
| Correlation | r = (1/(n − 1))Σ[(xᵢ − x̄)/s_x][(yᵢ − ȳ)/s_y] | −1 ≤ r ≤ 1 |
| Coefficient of determination | r² | Share of variation in y explained by x |
| Residual | e = y − ŷ | Observed minus predicted |
| Standard deviation of residuals | s = √[Σ(y − ŷ)²/(n − 2)] | df = n − 2 |
| Standard error of the slope | s_b = s/(s_x√(n − 1)) | Used in slope intervals and tests |
What Is the Difference Between Standard Deviation and Standard Error?
Standard deviation measures the spread of individual values, and standard error measures the spread of a statistic across repeated samples.
| Measure | Formula | Describes |
|---|---|---|
| Standard deviation | s = √[Σ(xᵢ − x̄)²/(n − 1)] | Spread of observations |
| Standard error of a mean | s/√n | Spread of sample means |
| Standard error of a proportion (interval) | √[p̂(1 − p̂)/n] | Spread of sample proportions |
| Standard error of a proportion (test) | √[p₀(1 − p₀)/n] | Spread under the null hypothesis |
| Standard error of a difference of means | √(s₁²/n₁ + s₂²/n₂) | Spread of the difference |
| Standard error of the slope | s_b | Spread of slope estimates |
Which Procedure Matches Which Situation?
The data type and the number of groups decide the procedure.
| Situation | Procedure | Statistic | Degrees of Freedom |
|---|---|---|---|
| One categorical variable, one group | One proportion z-test or interval | z | Not applicable |
| One quantitative variable, one group | One mean t-test or interval | t | n − 1 |
| Categorical variable, 2 independent groups | Two proportion z-test or interval | z | Not applicable |
| Quantitative variable, 2 independent groups | Two mean t-test or interval | t | From software |
| Quantitative variable, paired data | Matched pairs t-test or interval | t | n − 1 |
| Categorical variable, one group, several categories | Chi-square goodness of fit | χ² | Categories − 1 |
| Two categorical variables | Chi-square independence or homogeneity | χ² | (r − 1)(c − 1) |
| Two quantitative variables | Slope t-test or interval | t | n − 2 |
What Are Worked Examples of Statistics Formulas?
The 13 examples apply formulas from each group.
How to Calculate the Mean, Median, and Standard Deviation?
Worked example 1: the data set is 4, 8, 6, 5, 3, 7.
- Mean: 33/6 = 5.5
- Median: ordered values 3, 4, 5, 6, 7, 8 give (5 + 6)/2 = 5.5
- Sum of squared deviations: 6.25 + 2.25 + 0.25 + 0.25 + 2.25 + 6.25 = 17.5
- Sample standard deviation: s = √(17.5/5) = 1.87
How to Calculate a z-Score?
Worked example 2: a score of 85 comes from a distribution with μ = 70 and σ = 10. z = (85 − 70)/10 = 1.5.
How to Find Outlier Fences?
Worked example 3: Q₁ = 12 and Q₃ = 20.
- IQR: 20 − 12 = 8
- Lower fence: 12 − 1.5(8) = 0
- Upper fence: 20 + 1.5(8) = 32
How to Apply the Addition and Conditional Probability Rules?
Worked example 4: P(A) = 0.5, P(B) = 0.4, and P(A ∩ B) = 0.2.
- Union: 0.5 + 0.4 − 0.2 = 0.7
- Conditional: P(A | B) = 0.2/0.4 = 0.5, which equals P(A), so A and B are independent
How to Calculate a Binomial Probability?
Worked example 5: n = 10 trials with p = 0.3.
- P(X = 3) = 10C3 (0.3)³(0.7)⁷ = 120 × 0.027 × 0.0824 = 0.267
- Mean: 10 × 0.3 = 3
- Standard deviation: √(10 × 0.3 × 0.7) = 1.45
How to Calculate the Mean and Standard Deviation of a Discrete Random Variable?
Worked example 6: X takes the values 0, 1, and 2 with probabilities 0.2, 0.5, and 0.3.
- Mean: 0(0.2) + 1(0.5) + 2(0.3) = 1.1
- Variance: (1.21)(0.2) + (0.01)(0.5) + (0.81)(0.3) = 0.49
- Standard deviation: √0.49 = 0.70
How to Calculate the Standard Deviation of a Sample Proportion?
Worked example 7: p = 0.60 and n = 100.
- Conditions: np = 60 and n(1 − p) = 40, which both exceed 10
- Standard deviation: σ_p̂ = √(0.60 × 0.40/100) = 0.049
How to Build a Confidence Interval for a Proportion?
Worked example 8: p̂ = 0.54 and n = 400, at 95% confidence.
- Standard error: √(0.54 × 0.46/400) = 0.0249
- Margin of error: 1.960 × 0.0249 = 0.0488
- Interval: (0.491, 0.589)
How to Build a Confidence Interval for a Mean?
Worked example 9: x̄ = 52.0, s = 8.0, and n = 25, at 95% confidence with t* = 2.064.
- Standard error: 8.0/√25 = 1.6
- Margin of error: 2.064 × 1.6 = 3.30
- Interval: (48.7, 55.3)
How to Run a One-Proportion z-Test?
Worked example 10: H₀: p = 0.50, p̂ = 0.56, and n = 200.
- Standard error under H₀: √(0.50 × 0.50/200) = 0.0354
- Test statistic: z = 0.06/0.0354 = 1.70
- Two-sided p-value: about 0.090
- Decision at α = 0.05: fail to reject H₀
How to Run a Two-Sample t-Test for Means?
Worked example 11: group 1 has n = 30, x̄ = 78, s = 10, and group 2 has n = 35, x̄ = 72, s = 12.
- Standard error: √(100/30 + 144/35) = 2.73
- Test statistic: t = 6/2.73 = 2.20
- Degrees of freedom: about 63
- Two-sided p-value: about 0.03
How to Calculate a Chi-Square Statistic?
Worked example 12: observed counts 18, 22, 30, and 30 across 4 categories with expected counts of 25 each.
- Statistic: χ² = 49/25 + 9/25 + 25/25 + 25/25 = 4.32
- Degrees of freedom: 4 − 1 = 3
- p-value: about 0.23
How to Calculate a Regression Line?
Worked example 13: r = 0.80, s_x = 2, s_y = 5, x̄ = 10, and ȳ = 30.
- Slope: b = 0.80 × (5/2) = 2.0
- Intercept: a = 30 − 2.0 × 10 = 10
- Line: ŷ = 10 + 2.0x
- Prediction at x = 12: ŷ = 34
- Coefficient of determination: r² = 0.64
How to Use a Stats Formula Sheet?
Using a stats formula sheet takes 6 steps: identify, check, locate, substitute, calculate, and interpret.
- Identify the data type, the number of groups, and the question asked.
- Check the conditions for the procedure.
- Locate the formula in the matching group.
- Substitute the sample values with the correct symbols.
- Calculate the statistic, the interval, or the p-value.
- Interpret the result in the context of the problem.
The sheet supplies formulas, and students supply the definitions and interpretations.
What Are Common Mistakes With Statistics Formulas?
Common mistakes involve the wrong divisor, the wrong standard error, and unchecked conditions.
| Mistake | Correction |
|---|---|
| Dividing by n for a sample standard deviation | Divide by n − 1 |
| Using p̂ in the standard error of a test | Use p₀ in the standard error of a one-proportion test |
| Using z for a mean with unknown σ | Use t with df = n − 1 |
| Confusing standard deviation with standard error | Divide s by √n for the standard error of a mean |
| Skipping the large-count or normality condition | Check np ≥ 10, n(1 − p) ≥ 10, or n ≥ 30 first |
| Treating the p-value as the probability that H₀ is true | The p-value is the probability of a result at least as extreme, assuming H₀ |
| Pooling proportions in a confidence interval | Pool only in the two-proportion test |
| Using a chi-square test on percentages | Use counts |
People Also Ask About the Stats Formula Sheet
What is on the AP Statistics formula sheet?
The sheet lists descriptive statistics, probability and distribution, and inference formulas, followed by probability tables.
Do you get a formula sheet on the AP Statistics exam?
Yes, reference materials are available in print and in Bluebook.
Where can I download the AP Statistics formula sheet?
The official PDF is on the AP Central AP Statistics exam page under Exam Reference Information.
Can I bring my own formula sheet to the exam?
No, students use the sheet that the College Board provides.
Are calculators permitted on AP Statistics?
Yes, calculators are permitted.
Is the AP Statistics exam changing in 2027?
Yes, the revised course launches with the May 2027 exam, with 5 units and 4 free-response questions.
Is the AP Statistics exam digital?
From May 2027, the exam is fully digital in Bluebook.
What is the formula for standard deviation?
The sample standard deviation is s = √[Σ(xᵢ − x̄)²/(n − 1)].
What is the formula for a z-score?
The formula is z = (x − μ)/σ.
What is the formula for the binomial distribution?
The formula is P(X = x) = nCx · pˣ(1 − p)ⁿ⁻ˣ.
What is the general form of a confidence interval?
The form is statistic ± (critical value)(standard error).
What is the general form of a test statistic?
The form is (statistic − parameter)/(standard error).
What is the formula for the regression slope?
The formula is b = r(s_y/s_x).
What is a stats formula sheet in one sentence?
A stats formula sheet is a reference list of statistics formulas, grouped by topic, that supports calculation and inference.

The University of the West Indies
My passion as a teacher and leader in education is to contribute to students’ enhanced learning by creation of a positive teaching/learning environment, where they are motivated to develop strong critical thinking, analytical and problem-solving skills.
As acting Vice-Principal and head of Physics, I have amassed five years of experience in leading meetings, implementing strategies to maintain discipline and school ethos, liaise with stakeholders in planning for future development of the institution; successfully negotiated the implementation of various projects for student development as well as supervising effective execution of such. For the past 19 years, I have incorporated discovery learning within the classroom through practical activities, problem solving and cooperative learning and have realized that students retention in Physics and Mathematics have increased significantly.
I am always cognizant that students have different learning styles, and as such teaching strategies during planning and delivery must take this crucial factor into consideration and be tailored to meet such differences.